How RawCull Analyzes a Photo
Categories:
This visual tech doc follows the bird photograph _DSC8411.ARW through the analysis stages. The two supplied screenshots show a zoomed photo and a completed Objects review. They connect the technical concepts to a concrete example; they do not expose every intermediate measurement.
Annotations identify visible results and illustrative locations. The zoom screenshot does not show an active focus overlay, a measured local patch, or a camera AF coordinate. Its eye/detail callouts illustrate where inspection is useful; they do not claim that RawCull detected an eye. The neighboring thumbnails illustrate candidate frames, not a confirmed burst group.
Figure 1: From pixels to focus evidence
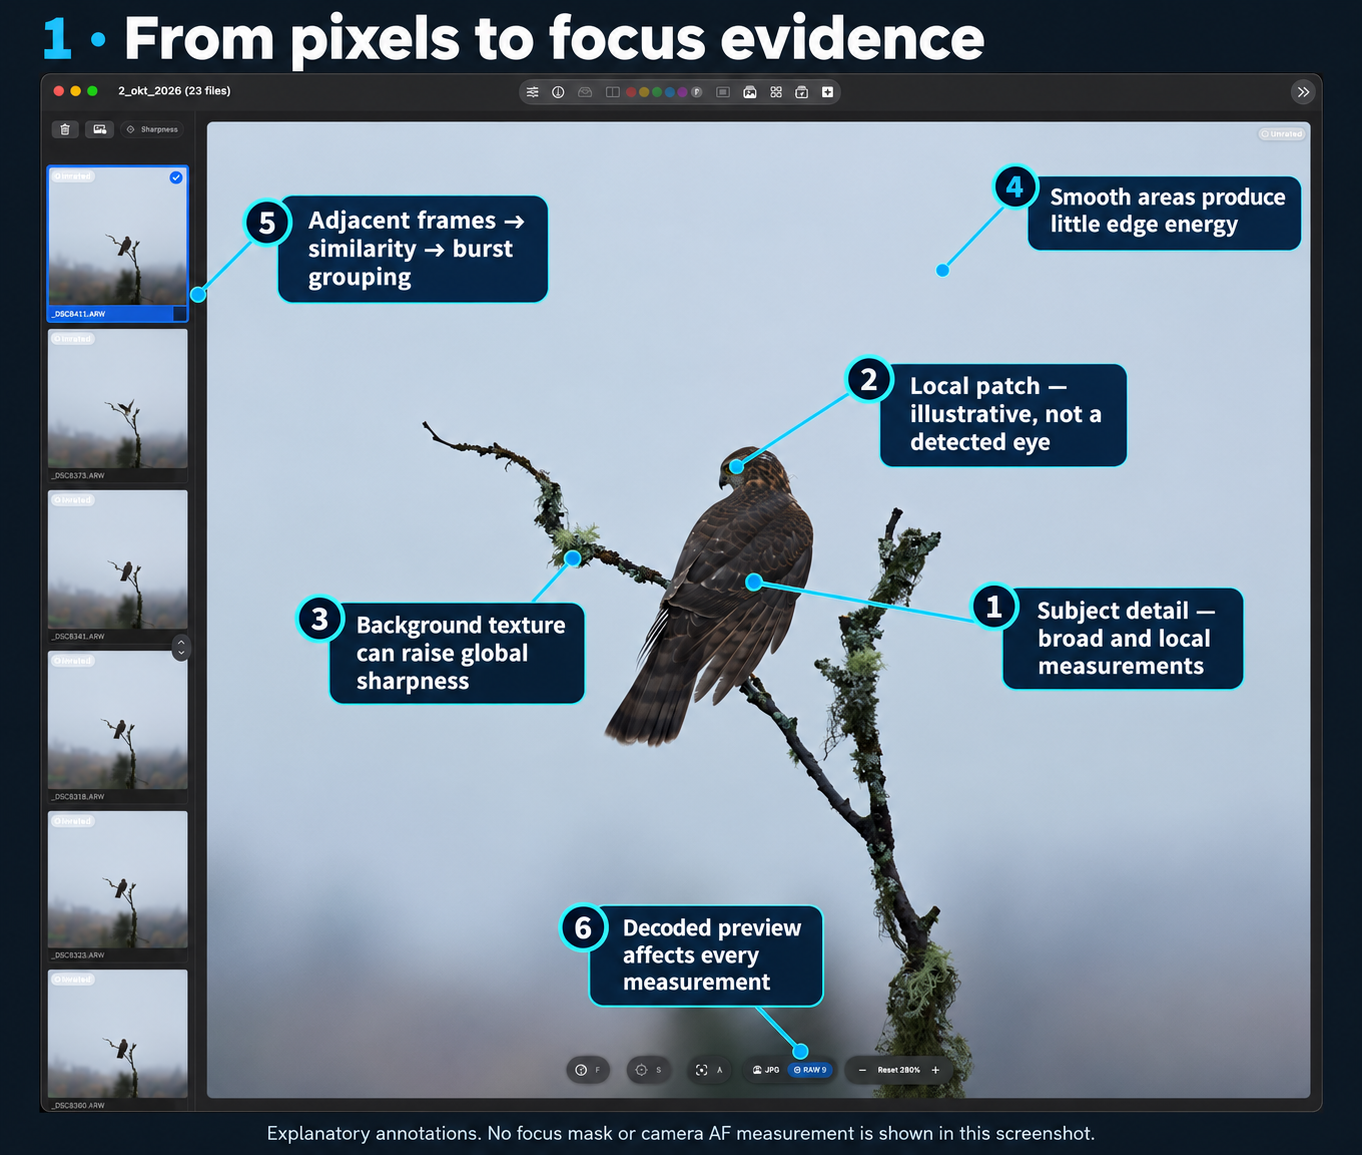
Decoded image detail, smooth sky, textured branches, local subject inspection, and neighboring candidate frames. The annotations explain possible sources of evidence; no measured focus mask is displayed.
| Callout | What it connects | Technical meaning |
|---|---|---|
| 1. Subject detail | Feather texture → regional sharpness | Broad subject and local measurements help distinguish subject detail from detailed surroundings. |
| 2. Local patch | Eye/head inspection → local evidence | The marked location is illustrative. Patch scoring uses spatial detail and heuristics; it does not prove eye detection. |
| 3. Background texture | Lichen and branches → global sharpness | Strong background edges can raise whole-frame detail even when the intended subject is soft. |
| 4. Smooth sky | Flat regions → low edge energy | The Laplacian responds to spatial changes; smooth regions usually contribute little detail. |
| 5. Neighboring frames | Candidate images → similarity and burst grouping | Actual grouping also needs compatible similarity representations, capture time, and metadata. |
| 6. Preview selection | Decoding → every pixel-based stage | Embedded JPEG and developed RAW can differ in resolution, sharpening, noise, and fine detail. |
Sharpness scoring applies pre-blur and a Laplacian detail signal, then reduces regional samples using robust-tail statistics. It blends broad AF/saliency evidence and local detail with the global score. The focus mask turns a related detail signal into spatial highlights using adaptive thresholds, morphology, and colorization. Its visible coverage is not the scalar sharpness score.
The camera AF point records where focus was attempted. Vision saliency supplies attention rectangles. Subject evidence explains how those regions are selected and how a separate SAM 3 mask can constrain deeper detail measurements.
Figure 2: Connecting models and measured evidence
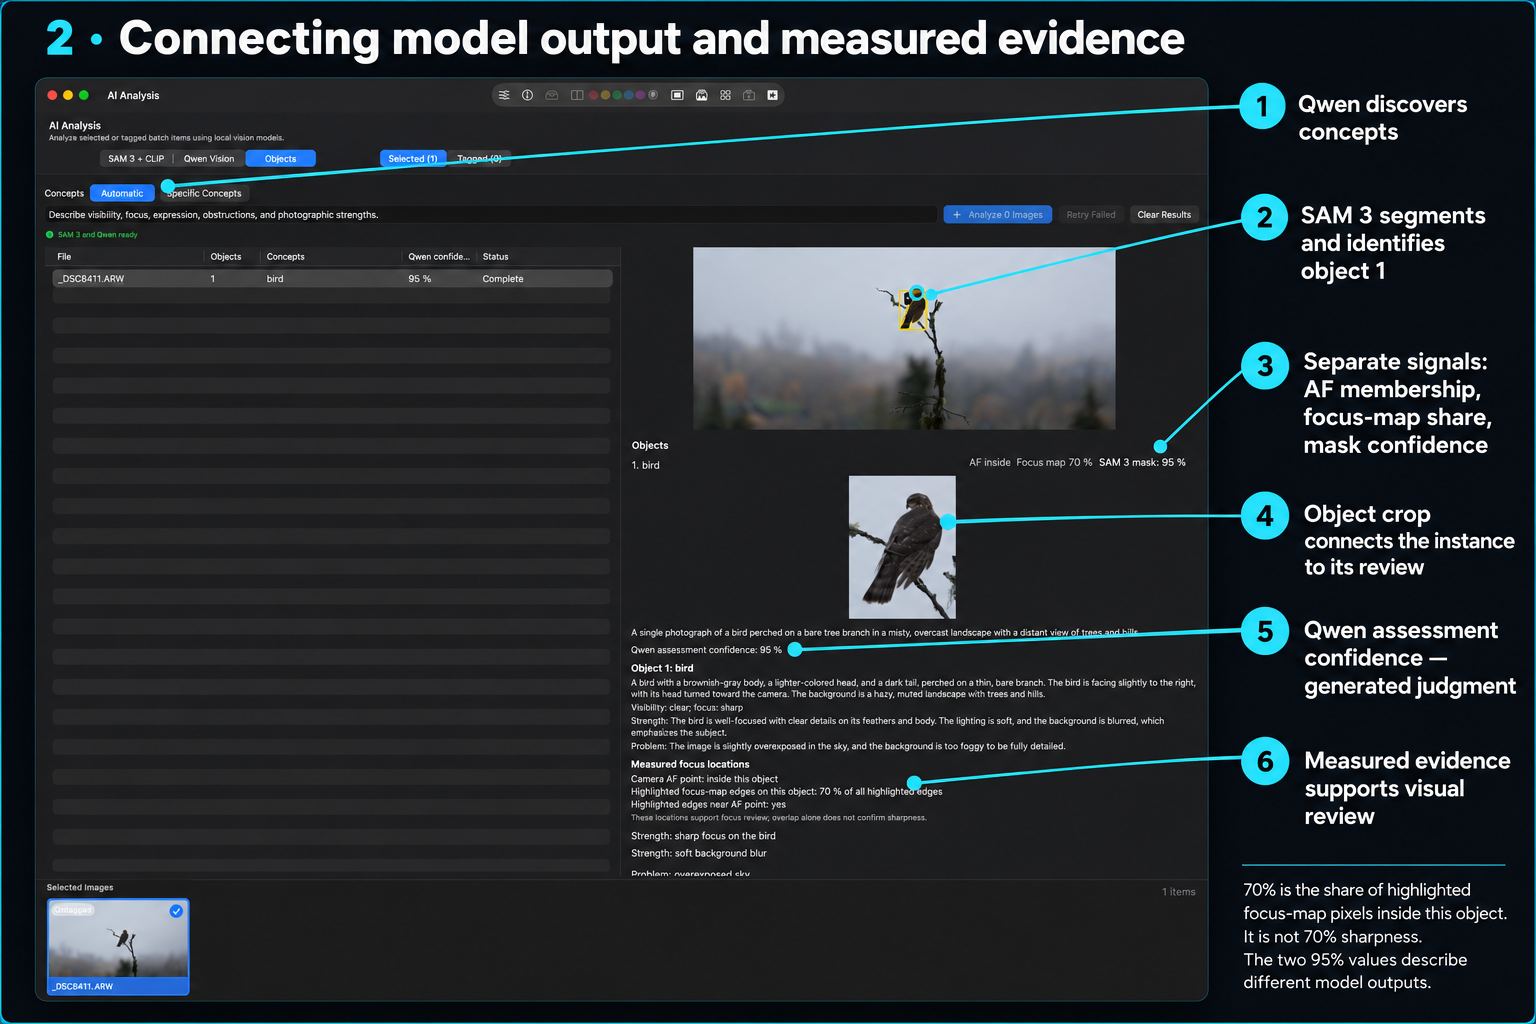
Objects review of the same bird photograph, connecting automatic concept discovery, SAM 3 instances, camera AF membership, focus-map overlap, and Qwen assessment. Displayed percentages have distinct meanings.
| Callout | Visible result or control | Technical meaning |
|---|---|---|
| 1. Automatic concepts | Automatic mode; concept bird | Qwen proposes concepts for SAM 3 to segment. Manual concept mode bypasses automatic discovery. |
| 2. Object instance | Bird marked as object 1 | SAM 3 supplies instance geometry and a mask. The application retains and deduplicates instances. |
| 3. Separate signals | AF inside, Focus map 70%, SAM 3 mask: 95% | AF membership, highlighted-pixel share, and segmentation confidence answer different questions. |
| 4. Object crop | Enlarged bird below the overview | The crop provides a readable view of the retained object. The workflow also prepares an identified object board for Qwen assessment. |
| 5. Qwen confidence | Qwen assessment confidence: 95% | This is generated assessment confidence, separate from SAM 3 confidence. |
| 6. Measured locations | AF and focus-map evidence below the assessment | These locations support review of the generated description; overlap alone does not confirm sharpness. |
Reading the percentages correctly
The screenshot reports Focus map 70%. In the object-evidence contract, this is the fraction of all highlighted focus-map pixels that lie inside this object:
focus-map share = highlighted pixels inside the object / all highlighted pixels
It does not mean that 70% of the bird is sharp or that the bird has a sharpness score of 0.70. It also differs from the focus-mask renderer’s coverage diagnostic, which measures visible highlights relative to the rendered search region.
SAM 3 mask: 95% describes segmentation confidence. Qwen assessment confidence: 95% describes a generated assessment. Equal displayed numbers do not make these interchangeable. The phrase “focus: sharp” is Qwen’s judgment, while the AF membership and focus-map share are separately computed spatial evidence.
How all the technical stages connect
| Stage | Input → result | Connection to the next stage |
|---|---|---|
| Decode | RAW file or embedded preview → analysis pixels | Supplies the image used by detail processing and model inference. |
| Sharpness | Pixels + metadata + AF/saliency regions → scalar and regional evidence | Supplies ordinary candidate ranking and explains where measured detail came from. |
| Focus mask | Detail energies + visual region + threshold → colored edge overlay | Provides spatial evidence for inspection and object overlap measurements. |
| Vision/CLIP index | Decoded images → compatible feature prints or embeddings | Supplies visual distances; CLIP also supports text-to-image semantic search. |
| Burst grouping | Adjacent distances + capture time + metadata → groups | Establishes which candidates are ranked together. |
| Burst ranking | Sharpness + AF availability + labels + metadata → recommendation and confidence | Narrows the candidate set for human inspection or optional deeper review. |
| SAM 3 | Image + concept or subject prompt → masks and instances | Defines geometry for subject-detail scoring and object review. |
| Masked Deep Review | Pixels inside selected mask → broad/local/fine detail score | Produces a separate subject-focused comparison, with fallback and quality evidence. |
| Qwen Vision | Image or object board + criteria → assessment | Adds generated judgments about visibility, composition, exposure, strengths, and problems. |
| Human review | Image + measurements + explanations → culling decision | Combines technical evidence with timing, pose, expression, and intent. |
These are connected branches, not a requirement to run every model on every file. Ordinary sharpness and focus-mask processing do not require all three optional model families. Vision feature prints support image similarity but do not provide a CLIP text encoder. The Objects workflow shown here combines Qwen and SAM 3; the screenshot does not establish that CLIP ran for this result.
The ordinary burst score uses deterministic weights: 62% ranking sharpness, 12% AF-point availability, 10% saliency label evidence, and 16% metadata. Masked Deep Review instead combines 40% broad detail, 40% local detail, and 20% fine detail before its background penalty. A valid structured Qwen photo assessment uses 50% composition, 20% exposure, and 30% subject visibility after normalizing its generated 1–5 ratings. That photo formula is separate from the Objects narrative shown in Figure 2.
Neither screenshot shows index vectors, pairwise distances, burst confidence, or the numeric sharpness breakdown. Those stages are explained here through their source-defined connections, not inferred values for this photograph.
Detailed references
- Sharpness scoring: pixel statistics and numeric blends.
- Focus mask: spatial rendering and adaptive thresholds.
- Vision and CLIP indexes: representations and compatibility.
- Subject evidence: AF, saliency, masks, and local detail.
- Burst groups: boundaries and deterministic ranking.
- CLIP model, SAM 3 model, and Qwen Vision model: individual model roles.
The displayed object-location evidence is implemented in RawCull/RawCull/Intelligence/ObjectAnalysis/ObjectAnalysisModels.swift; the orchestration is in RawCullObjectAnalysisFeature.swift. This page uses the supplied screenshots as visual examples and the source snapshot described in the technical index.
Feedback
Was this page helpful?
Glad to hear it! Please tell us how we can improve.
Sorry to hear that. Please tell us how we can improve.