These tech docs describe how RawCull computes analysis results, stores evidence, and turns measurements into review recommendations. They are intended for readers who want implementation detail beyond the user guides.
The reference is the local RawCull source inspected on 6 October 2026, primarily the RawCull/RawCull application, RawCullCore, PhotoAnalysisKit, and PhotoAIKit. Defaults and algorithms describe that source snapshot; they do not establish which features are available in an App Store release. RawCullBrowse and RawCullFB have separate integrations and should not be assumed to behave identically.
Vision-language generation, structured scores, and object assessment
The three principal AI model families are CLIP, SAM 3, and Qwen Vision. The AI tabs combine them: SAM 3 + CLIP uses segmentation and semantic evidence, Qwen Vision performs image assessment, and Objects combines SAM 3 instances with Qwen. Apple Vision also supplies feature prints, attention saliency, and classification. EfficientSAM has a separate provider in the source tree; it is not one of the three families documented here.
How the stages connect
Decode a photograph into an analysis image and read available camera metadata.
Measure sharpness and retain regional focus evidence.
Index visual representations and compare adjacent photographs.
Create burst boundaries and rank candidates using deterministic rules.
Run optional subject-mask or vision-language review on a smaller candidate set.
A similarity distance, a sharpness scalar, a segmentation confidence, and a generated assessment score have different meanings. Their scales cannot be interchanged. The pages below identify the computation and its limits at each stage.
An illustrated connection between pixels, focus evidence, similarity, segmentation, burst ranking, and AI assessment.
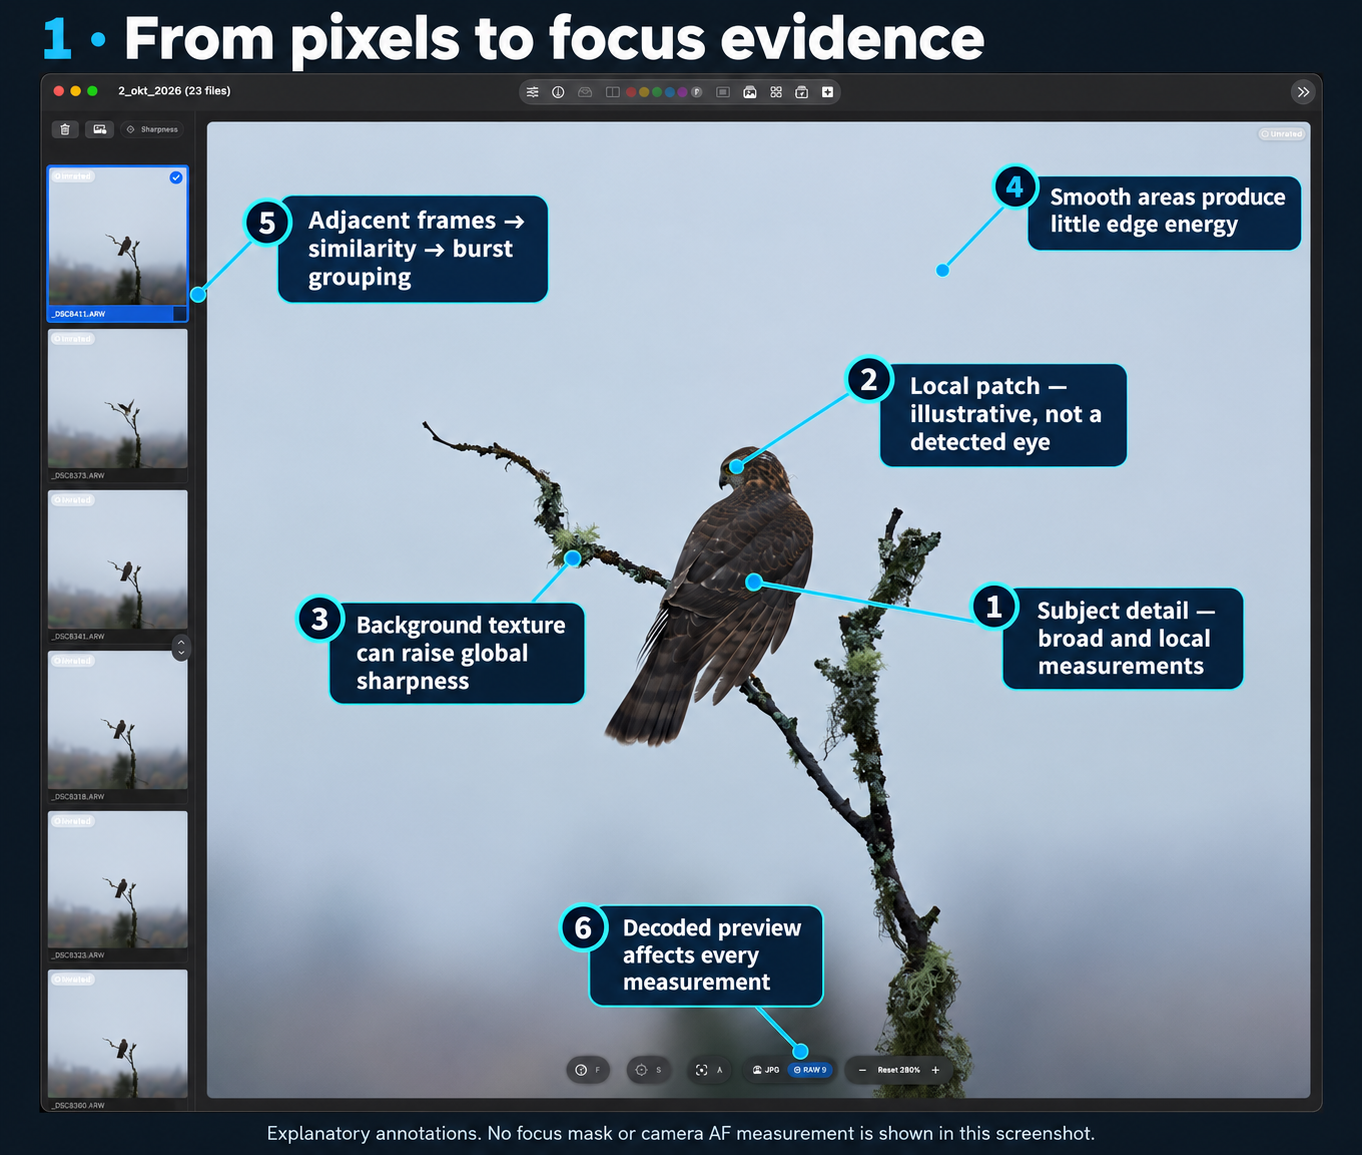
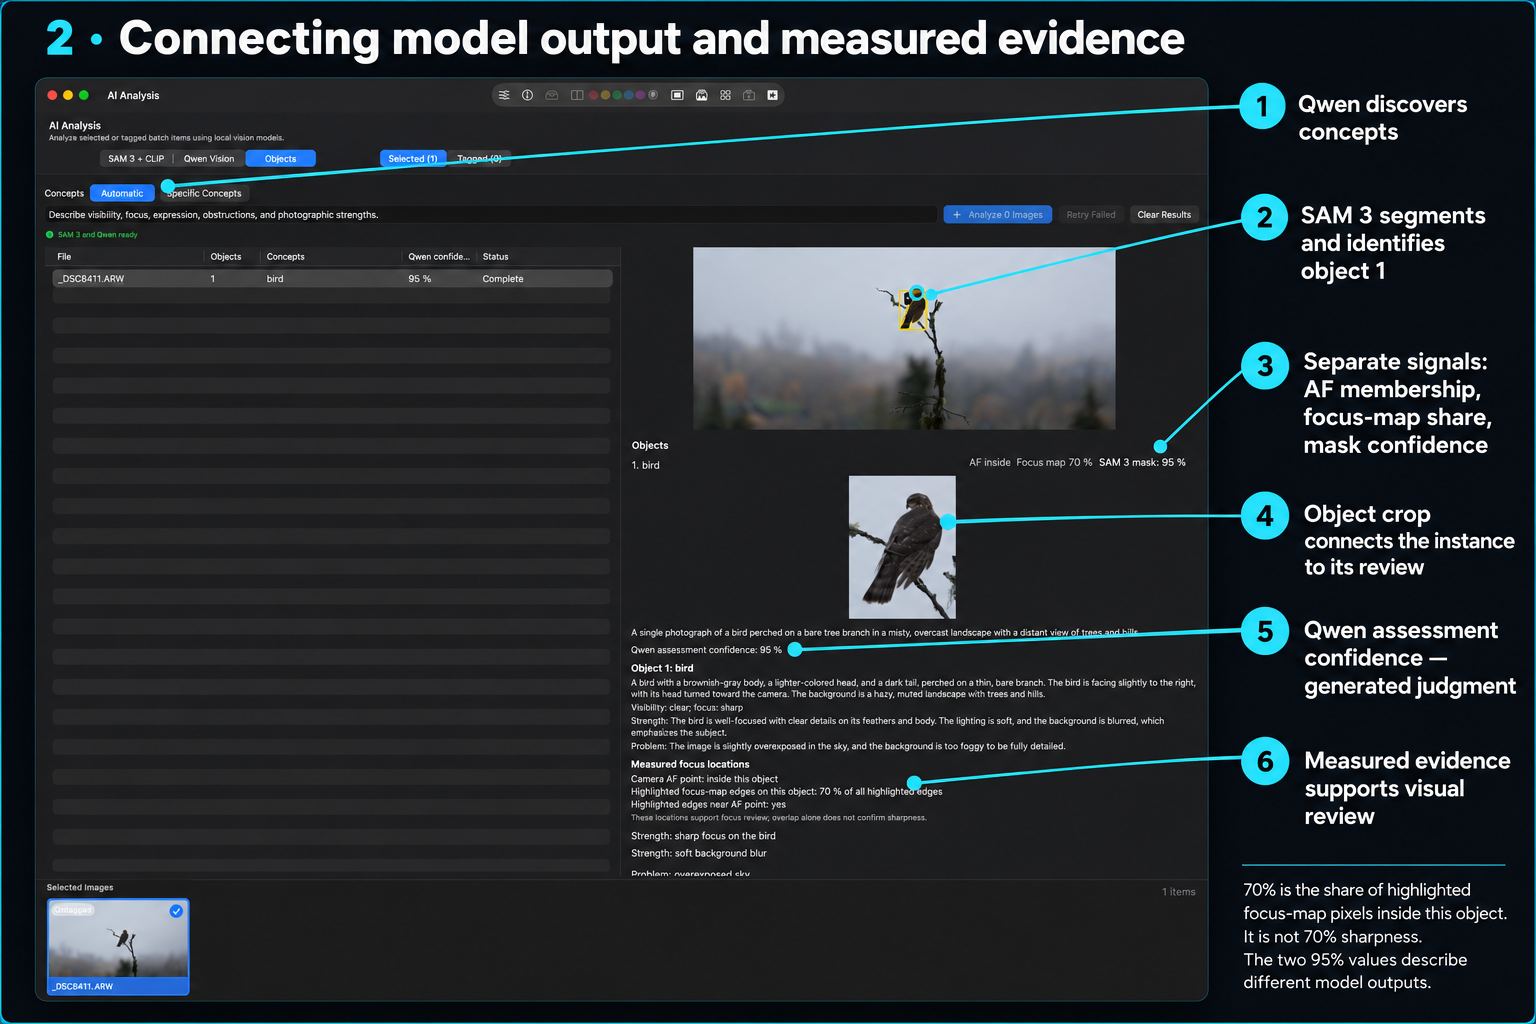
This visual tech doc follows the bird photograph _DSC8411.ARW through the analysis stages. The two supplied screenshots show a zoomed photo and a completed Objects review. They connect the technical concepts to a concrete example; they do not expose every intermediate measurement.
Annotations identify visible results and illustrative locations. The zoom screenshot does not show an active focus overlay, a measured local patch, or a camera AF coordinate. Its eye/detail callouts illustrate where inspection is useful; they do not claim that RawCull detected an eye. The neighboring thumbnails illustrate candidate frames, not a confirmed burst group.
Figure 1: From pixels to focus evidence
Decoded image detail, smooth sky, textured branches, local subject inspection, and neighboring candidate frames. The annotations explain possible sources of evidence; no measured focus mask is displayed.
Callout
What it connects
Technical meaning
1. Subject detail
Feather texture → regional sharpness
Broad subject and local measurements help distinguish subject detail from detailed surroundings.
2. Local patch
Eye/head inspection → local evidence
The marked location is illustrative. Patch scoring uses spatial detail and heuristics; it does not prove eye detection.
3. Background texture
Lichen and branches → global sharpness
Strong background edges can raise whole-frame detail even when the intended subject is soft.
4. Smooth sky
Flat regions → low edge energy
The Laplacian responds to spatial changes; smooth regions usually contribute little detail.
5. Neighboring frames
Candidate images → similarity and burst grouping
Actual grouping also needs compatible similarity representations, capture time, and metadata.
6. Preview selection
Decoding → every pixel-based stage
Embedded JPEG and developed RAW can differ in resolution, sharpening, noise, and fine detail.
Sharpness scoring applies pre-blur and a Laplacian detail signal, then reduces regional samples using robust-tail statistics. It blends broad AF/saliency evidence and local detail with the global score. The focus mask turns a related detail signal into spatial highlights using adaptive thresholds, morphology, and colorization. Its visible coverage is not the scalar sharpness score.
The camera AF point records where focus was attempted. Vision saliency supplies attention rectangles. Subject evidence explains how those regions are selected and how a separate SAM 3 mask can constrain deeper detail measurements.
Figure 2: Connecting models and measured evidence
Objects review of the same bird photograph, connecting automatic concept discovery, SAM 3 instances, camera AF membership, focus-map overlap, and Qwen assessment. Displayed percentages have distinct meanings.
Callout
Visible result or control
Technical meaning
1. Automatic concepts
Automatic mode; concept bird
Qwen proposes concepts for SAM 3 to segment. Manual concept mode bypasses automatic discovery.
2. Object instance
Bird marked as object 1
SAM 3 supplies instance geometry and a mask. The application retains and deduplicates instances.
3. Separate signals
AF inside, Focus map 70%, SAM 3 mask: 95%
AF membership, highlighted-pixel share, and segmentation confidence answer different questions.
4. Object crop
Enlarged bird below the overview
The crop provides a readable view of the retained object. The workflow also prepares an identified object board for Qwen assessment.
5. Qwen confidence
Qwen assessment confidence: 95%
This is generated assessment confidence, separate from SAM 3 confidence.
6. Measured locations
AF and focus-map evidence below the assessment
These locations support review of the generated description; overlap alone does not confirm sharpness.
Reading the percentages correctly
The screenshot reports Focus map 70%. In the object-evidence contract, this is the fraction of all highlighted focus-map pixels that lie inside this object:
focus-map share = highlighted pixels inside the object / all highlighted pixels
It does not mean that 70% of the bird is sharp or that the bird has a sharpness score of 0.70. It also differs from the focus-mask renderer’s coverage diagnostic, which measures visible highlights relative to the rendered search region.
SAM 3 mask: 95% describes segmentation confidence. Qwen assessment confidence: 95% describes a generated assessment. Equal displayed numbers do not make these interchangeable. The phrase “focus: sharp” is Qwen’s judgment, while the AF membership and focus-map share are separately computed spatial evidence.
How all the technical stages connect
Stage
Input → result
Connection to the next stage
Decode
RAW file or embedded preview → analysis pixels
Supplies the image used by detail processing and model inference.
Sharpness
Pixels + metadata + AF/saliency regions → scalar and regional evidence
Supplies ordinary candidate ranking and explains where measured detail came from.
Combines technical evidence with timing, pose, expression, and intent.
These are connected branches, not a requirement to run every model on every file. Ordinary sharpness and focus-mask processing do not require all three optional model families. Vision feature prints support image similarity but do not provide a CLIP text encoder. The Objects workflow shown here combines Qwen and SAM 3; the screenshot does not establish that CLIP ran for this result.
The ordinary burst score uses deterministic weights: 62% ranking sharpness, 12% AF-point availability, 10% saliency label evidence, and 16% metadata. Masked Deep Review instead combines 40% broad detail, 40% local detail, and 20% fine detail before its background penalty. A valid structured Qwen photo assessment uses 50% composition, 20% exposure, and 30% subject visibility after normalizing its generated 1–5 ratings. That photo formula is separate from the Objects narrative shown in Figure 2.
Neither screenshot shows index vectors, pairwise distances, burst confidence, or the numeric sharpness breakdown. Those stages are explained here through their source-defined connections, not inferred values for this photograph.
The displayed object-location evidence is implemented in RawCull/RawCull/Intelligence/ObjectAnalysis/ObjectAnalysisModels.swift; the orchestration is in RawCullObjectAnalysisFeature.swift. This page uses the supplied screenshots as visual examples and the source snapshot described in the technical index.
2 - Sharpness Scoring — Technical Detail
Technical documentation of RawCull analysis implementation and result computation.
Sharpness is a deterministic measurement of spatial detail in the decoded analysis image. Vision supplies attention regions and optional labels; the numeric detail score comes from image processing in PhotoAnalysisKit.
Image and edge-energy pipeline
The scorer normalizes input to 8-bit sRGB RGBA. It applies Gaussian pre-blur, then the Metal focusLaplacian kernel and a fixed scoring gain. Pre-blur suppresses noise before second-derivative energy is measured. Its effective radius is:
The ISO multiplier is 1 below ISO 800, rises linearly to 1.6 at ISO 3200, then rises to a cap of 2.2 at ISO 9600. The landscape aperture hint uses a blur damping factor of 0.8. Quality settings can blend a second, finer Laplacian pass: its pre-blur radius is max(0.35, primaryRadiusSetting × 0.58) and the blend weight is clamped to 0–0.65. This preserves small textured detail while retaining the normal noise suppression pass.
The energy image is rendered as floating-point RGBA. The scorer samples its red channel, excluding a configurable outer border to avoid edge artifacts. Preview resolution, decoding mode, ISO, aperture hints, and quality configuration affect the measurement; the score is not a camera-independent optical resolution metric.
Robust-tail statistic
For a sample set of size N, percentile indices use floor((N−1) × p). Let p20, p90, and p97 be the corresponding energies. The score is:
band = samples whose energy is between p90 and p97, inclusive
bandMean = mean(max(0, energy − p20)) over band
density = min(1, (band.count / N) / 0.06)
robustTail = bandMean × density
If p97 <= p90, or the band is empty, the result is max(0, p90−p20). An empty sample set has no score. Subtracting p20 provides a background energy reference; excluding the highest tail reduces the influence of isolated extreme edges. The density factor attenuates sparse evidence.
Micro-contrast is the standard deviation of finite energy samples, computed as sqrt(max(0, mean(x²)−mean(x)²)). It measures variation in the processed detail signal, not exposure contrast in the original photograph.
Regional measurements and final scalar
The breakdown retains whole-frame, selected saliency, AF-region, AF-center, and AF-neighborhood scores. Broad saliency and AF regions require at least 64 samples; the tighter AF center requires 16. Saliency selection favors overlap with the recorded AF location, then proximity, confidence, interior detail, and area.
When both broad AF and saliency measurements exist, the subject score begins as 0.60 × AF + 0.40 × saliency. A local-detail estimate similarly combines the selected AF-neighborhood and subject-interior patches. When broad and local evidence both exist, the conservative subject score is 0.75 × broad + 0.25 × local. Available evidence is used alone when the other component is absent.
The frame/subject blend is (1−w) × global + w × subject. Weight precedence is explicit override, aperture-hint override, then configured salient weight. If global evidence exists without any subject measurement, the fallback is global × (1−w)³.
Two further adjustments apply to the blend. A silhouette penalty starts when the outer 12% rim of the selected subject region dominates the interior: the implementation uses the ratio of rim mean to the sum of rim and interior means, with a threshold of 0.62. The penalty increases with excess dominance and the configured strength. A saliency-only subject-size bonus multiplies by 1 + normalizedArea × subjectSizeFactor; an available AF region disables that bonus.
Finally, subject micro-contrast drives an aperture-dependent blur gate. Between the low and high configured thresholds the multiplier rises linearly from 0.20 to 1.0. With insufficient subject samples it is 1.0. This is a soft attenuation, so low-contrast subject detail does not encounter a hard rejection boundary.
Calibration and interpretation
See Focus mask for the full overlay rendering pipeline, including local adaptive thresholds and morphology.
FocusMaskCalibration samples positive finite overlay-detail energies and selects a percentile threshold, default p90, clamped to 0.01–0.95. It requires at least five successful images by default. This calibrates the visual focus-mask threshold only. Scalar scoring uses stableScoringEnergyMultiplier and is independent of the catalog’s calibration threshold.
The final scalar, AF-point measurement, focus-mask overlay, and masked Deep Review score remain distinct results. A high whole-frame measurement can come from a detailed background; an AF coordinate records where focus was attempted, not proof that focus succeeded.
Source map
PhotoAnalysisKit/Sources/PhotoAnalysisKit/FocusMaskEngine+Scoring.swift: energy processing, statistics, regional selection, blending, and attenuation.
Technical documentation of focus-mask edge detection, region selection, adaptive thresholds, and rendering.
The focus mask renders spatial detail as a colored overlay. It answers where the decoded image contains strong edge energy. It shares low-level processing with sharpness scoring, but its thresholds and visual styling serve a different purpose from the scalar ranking score.
This page describes the RawCull source inspected on 6 October 2026. For controls and keyboard shortcuts, see the Focus Mask user guide.
Detail signal and image scale
FocusMaskEngine transforms the input image by the requested scale before computing detail. “Native pixels” here means pixels of that scaled analysis image, which may be an embedded preview rather than the camera’s full RAW sensor data.
buildFocusMaskDetail sets the pre-blur parameter to max(0.35, configuredPreBlurRadius × 0.52) and calls the shared amplified Laplacian pipeline in native-mask mode. The effective Gaussian radius is:
Native-mask mode uses a resolution multiplier of 1, clamps input to its extent before blurring, and evaluates the kernel over the original extent. Clamping prevents the image boundary from introducing artificial detail. ISO and aperture damping follow the shared pipeline described in sharpness scoring.
The Metal kernel computes a 3×3 discrete Laplacian independently for each RGB channel, then combines absolute responses with Rec. 601 weights:
The scalar is packed into RGB, amplified by the configured energy multiplier, and retained as floating-point image data. Unlike scalar scoring’s fixed gain, the mask uses the configured amplification setting. Texture, noise, JPEG sharpening, preview resolution, and blur settings all influence this signal.
Choosing the visual region
When subject isolation is enabled, rendering can reuse the winning saliency rectangle and region from existing focus evidence. If a saliency rectangle is unavailable, the mask-only entry point can request attention saliency without classification and select a candidate using AF evidence.
Normalized AF coordinates are converted to Core Image coordinates using y = 1−yAF. AF squares and saliency rectangles are intersected with unit bounds, mapped into pixel coordinates, rounded outward to integral rectangles, and clipped to the image extent.
The visual region can be AF center, AF neighborhood, broad AF region, saliency, mixed AF and saliency, or global. The renderer honors a requested evidence region when its geometry exists; otherwise it falls back to broad AF, then saliency, then global. Disabling subject isolation explicitly chooses global edges.
Mixed mode searches both AF and saliency rectangles. These are rectangular regions, not SAM 3 pixel masks. A subject-isolated focus overlay therefore may contain background detail within the selected rectangle. Subject evidence explains the separate segmented-subject scorer.
Local patches and visible extent
The renderer ranks overlapping patches within the search regions. Patch width and height start at 34% of the corresponding region dimension, bounded between 3.5% and 14% of the full image dimension. Sampling steps are half the patch dimensions, with a minimum of one pixel. An AF-centered patch is added when sufficiently contained, and rendering also evaluates a patch spanning 6% of the image width and height around AF.
Patch evidence includes robust-tail detail, micro-contrast, coverage, AF distance, silhouette fraction, and shape heuristics. Selection retains up to three positive finite composite scores while excluding patches with overlap ratio >= 0.55 relative to the smaller patch. For AF-anchored evidence, the nearest patch can precede the strongest when the strongest is less than 1.15 times its composite score.
These patches summarize evidence. They do not truncate the visible overlay: threshold sampling and clipping use the complete search rectangles. Shape heuristics for compact or ring-like detail are not an eye detector or proof that the subject’s eye is in focus.
Adaptive threshold
The renderer sorts positive finite energies from the visual search regions. Its percentile uses floor((N−1) × percentile). Let T be the configured threshold, which may have come from catalog calibration:
Visual region
Percentile
Minimum floor
Cap percentile value at T
AF center, neighborhood, or broad AF
p82
max(0.32 × T, 0.01)
Yes
Saliency, mixed, or global
p90
max(0.55 × T, 0.01)
No
The effective threshold is the selected percentile value, optionally capped at T, clamped between the floor and 0.95. If no positive finite samples exist, the result is the floor capped at 0.95.
The rendering path does not lower this threshold to satisfy a minimum visible coverage. Weak detail may produce an empty mask, and the recorded relaxedForVisibility flag is false. Although the source contains a visibility-relaxation helper, this rendering path does not call it.
Catalog calibration is another stage: it samples positive detail energies across images and supplies an overlay threshold, default p90. It does not recalibrate the fixed scalar sharpness gain. Local adaptive rendering then derives the effective threshold from this configured fallback and the visual region.
Thresholding, morphology, and color
The renderer copies the energy’s red channel into grayscale and applies CIColorThreshold. It optionally erodes the binary image with CIMorphologyMinimum, then dilates it with CIMorphologyMaximum. Erosion removes small or narrow features; dilation expands surviving highlights. Their order matters because dilation operates on the eroded result.
A color matrix maps the binary signal to orange-red RGB coefficients (1.0, 0.22, 0.02) and alpha coefficient 0.92. The image is clipped to the union of search rectangles over a transparent background. Optional Gaussian feathering follows clipping, and the result is cropped to the analysis-image extent before becoming a CGImage. Feathering can soften highlights beyond a region boundary before the final image crop.
The raw-Laplacian diagnostic option bypasses thresholding, morphology, colorization, and subject-region clipping and returns the cropped amplified detail image. Its recorded region source still describes available selection geometry; it does not imply that the raw image was region-isolated.
Coverage and diagnostics
Rendered coverage is measured after morphology and feathering. Alpha above 0.05 counts as visible. Core Image area-average reductions measure visible pixels within the union of search regions and divide by that union’s area fraction. This is a fraction of the rendered region, not SAM 3 subject coverage and not a fraction of pixels proven optically sharp.
The breakdown records region source and effective threshold. Focus evidence also retains visualized region, overlay style, patch rankings, rendered coverage, and alignment/confidence diagnostics. The region source describes available saliency/AF geometry, while the visualized region identifies the actual evidence region used for rendering.
Core Image and Vision work runs in a cancellable background worker using an immutable configuration snapshot. Cancellation checks stop obsolete analysis and rendering. An empty overlay may indicate insufficient edge energy; failure or cancellation can instead return no image, so these cases should not be interpreted identically.
Source map
PhotoAnalysisKit/Sources/PhotoAnalysisKit/FocusMaskEngine+MaskGeneration.swift: region selection, patches, thresholds, morphology, colorization, and coverage.
PhotoAnalysisKit/Sources/PhotoAnalysisKit/Resources/Kernels.ci.metal: 3×3 Laplacian and channel weighting.
PhotoAnalysisKit/Sources/PhotoAnalysisKit/FocusMaskEngine+Scoring.swift: shared amplified detail pipeline and regional scoring.
PhotoAnalysisKit/Sources/PhotoAnalysisKit/FocusMaskTypes.swift: region, patch, evidence, and diagnostic types.
RawCull/RawCull/Model/ViewModels/FocusandSharpness/FocusMaskModel.swift: application-facing generation and calibration adapter.
4 - Vision and CLIP Indexes — Technical Detail
Technical documentation of RawCull analysis implementation and result computation.
RawCull supports two different visual representations: Apple Vision feature prints and CLIP embeddings. An index stores reusable representations keyed to photographs, avoiding repeated inference for every comparison. The representations are not interchangeable.
Vision feature prints
VisionFeaturePrintBackend creates a VNGenerateImageFeaturePrintRequest, using revision 2 by default. Vision produces a VNFeaturePrintObservation; the provider securely archives that observation as the artifact payload. Callers receive a typed artifact rather than the Vision object itself.
Comparison securely decodes both observations and calls computeDistance. A lower distance indicates greater visual similarity. The provider verifies compatible descriptors and rejects non-finite distances. Apple’s feature representation and distance internals are framework-owned: RawCull does not implement an explicit cosine formula for these observations.
The descriptor records vision-feature-print, the request revision, archive representation version, and framework-managed preprocessing/normalization identifiers. There is no public embedding dimension in this artifact. Vision feature prints do not provide a text encoder, so a Vision index alone cannot implement CLIP semantic text search.
CLIP vector indexes
CLIP produces numeric image embeddings and matching text embeddings. Image vectors are L2-normalized where configured. For compatible image vectors a and b, the contract computes:
Comparison requires matching backend, model identity, nonempty vectors of equal length, and positive magnitudes. Invalid or incompatible comparisons return no distance. Identical directions give distance 0; orthogonal directions give 1. This scale must not be interpreted as a calibrated probability or reused as a Vision distance scale.
Image-to-image comparisons support visual similarity. Text-to-image comparisons support semantic search using the selected model’s shared representation. See CLIP model for tensor preprocessing and inference.
Compatibility and freshness
SimilarityArtifactDescriptor separates the source fingerprint from backend identity. Distance compatibility checks the representation and backend configuration fields, including model fingerprint, dimensions, preprocessing version, normalization version, and configuration version. Two different photos may be compared when those fields agree; their source fingerprints are expected to differ.
The source fingerprint describes the input used to create an artifact. Index reuse must also establish that the artifact still belongs to the current source. A model or preprocessing change can require rebuilding representations even if the photograph is unchanged. Mixing CLIP model variants produces incompatible vectors even when their dimensions happen to match.
Index execution and fallback
SimilarityArtifactIndexer decodes images and asks a provider to generate artifacts using bounded concurrency, default two tasks. It returns successful artifacts, per-source failures, and whether whole-batch fallback occurred. It checks cancellation and reports completed item counts.
Fallback is an explicit policy: none, per-item, or whole-batch. Whole-batch fallback reruns all sources with the fallback provider if the initial pass has failures. Per-item fallback can yield representations from different backends, but compatibility checks still prevent cross-backend distance calculation. The existence of a package fallback policy does not imply that every application workflow enables it.
Burst grouping consumes adjacent-file distances rather than comparing every possible pair. Missing similarity evidence creates a boundary in the grouping engine. This prevents an unmeasured pair from being treated as a confident match.
Source map
PhotoAIKit/Sources/VisionFeaturePrintBackend/VisionFeaturePrintBackend.swift: generation, secure archive, and native distance.
PhotoAIKit/Sources/PhotoAIContracts/SimilarityArtifact.swift and ImageEmbedding.swift: representation compatibility and cosine distance.
PhotoAIKit/Sources/PhotoAIWorkflows/SimilarityArtifactIndexer.swift: indexing and fallback policies.
RawCull/RawCull/Intelligence/Similarity/RawCullSimilarityFeature.swift and RawCullVisionSimilarityService.swift: application integrations.
5 - Subject Evidence — Technical Detail
Technical documentation of RawCull analysis implementation and result computation.
Subject evidence tells RawCull where a measurement came from and how trustworthy that region is. It combines camera metadata, Vision attention regions, optional classification, segmentation geometry, and measured interior detail. These signals answer different questions and retain separate provenance.
Camera AF and Vision saliency
A normalized camera AF coordinate records where autofocus was attempted. For Vision saliency comparisons the scorer flips the vertical coordinate with yVision = 1−yAF. Incorrect coordinate conventions would select a different region of the photograph.
VNGenerateAttentionBasedSaliencyImageRequest supplies candidate bounding boxes. A candidate survives when its normalized area exceeds 0.03 or its confidence is at least 0.9. Selection prioritizes AF overlap, distance to the AF point, saliency confidence, measured detail, area, and a deterministic geometric tie break. This is attention-based region selection, not pixel segmentation.
Optional VNClassifyImageRequest supplies a whole-image label. The label-selection code first looks for subject-related keywords at confidence 0.06 or higher, then accepts non-environment labels at 0.15 or higher. The stored saliency summary’s subjectConfidence comes from the maximum salient-object confidence; it should not be read as the classification label’s posterior probability.
The sharpness breakdown also retains AF-center and neighborhood evidence, local scoring patches, the selected region, and selection reason. See sharpness scoring for the numeric blends.
Segmentation acquisition and quality
SubjectMaskSelector checks a repository for a cached mask, then optionally generates one. Its package defaults try subject, person, bird, and animal prompts, stop at the first acceptable result, and require at least warning-level geometry. RawCull’s Deep Review chooses its own prompt sequence according to Auto, Full Subject, or Head/Face presets and the subject label.
Mask geometry describes normalized coverage and bounding box. Quality is poor for an empty box, coverage at or below 0.005, or coverage at or above 0.90. A good mask has fresh geometry, coverage in 0.02–0.70, and no box edge within 0.02 of an image edge; other usable masks receive a warning. These checks measure geometric plausibility, not semantic correctness. Selection records attempts, confidence, cache origin, and whether minimum quality was met.
Masked detail measurement
SubjectMaskFocusScorer resizes the mask to the analysis image and converts image RGB into luminance:
Y = (0.2126R + 0.7152G + 0.0722B) / 255
energy = abs(4Y − Yleft − Yright − Yup − Ydown)
It excludes a border of max(2, min(width,height)/250) pixels. A pixel belongs to the subject when mask alpha exceeds 16 on the 0–255 scale. Coverage is the counted subject pixels divided by the full image pixel count.
Broad detail is the robust-tail statistic over subject energies; fine detail is their standard deviation. For local evidence, the image is divided into a 6×6 grid. A patch needs at least max(64, 0.08 × nominalPatchArea) masked samples. Each valid patch scores robustTail + 0.35 × microContrast; the best patch supplies local detail.
maskedScore = 0.40 × broad + 0.40 × (local, or broad if local is absent)
              + 0.20 × fine
If whole-image robust-tail energy exceeds max(maskedScore × 1.45, maskedScore + 0.04), the scorer applies a background-dominance multiplier of 0.82. It records whether a local patch was usable, whether AF lies inside the mask, and whether that penalty applied. AF membership is evidence; it is not an extra numeric bonus in this formula.
This scorer uses a luminance Laplacian directly. It is a separate computation from the pre-blurred Metal pipeline used by ordinary sharpness, so their raw scalars should not be compared as though they share a calibration.
Deep Review result and confidence
The application stores the masked final score as deepScore, alongside ordinary sharpness, prompt, mask confidence, coverage, local detail, fallback status, and issues. Groups of more than 12 input candidates are narrowed to eight for detailed review; otherwise all candidates are considered.
Deep Review confidence uses the relative lead (firstScore−secondScore)/max(firstScore,1e−6). High confidence requires a lead of at least 0.12, a mask prompt, local detail, no issues, and no fallback mask. A lead of at least 0.05, or strong evidence with a fallback mask, gives medium confidence. Other cases give low confidence. This rule differs from the absolute score gaps in ordinary burst ranking.
Source map
PhotoAnalysisKit/Sources/PhotoAnalysisKit/FocusMaskEngine+Scoring.swift: attention, classification, and AF region handling.
PhotoAIKit/Sources/PhotoAIWorkflows/SubjectMaskSelection.swift, SubjectMaskGeometry.swift, and SubjectMaskQuality.swift: acquisition and geometry checks.
RawCull/RawCull/Intelligence/DeepReview/DeepAIReviewFeature.swift: candidate selection, evidence, and confidence.
6 - Burst Groups — Technical Detail
Technical documentation of RawCull analysis implementation and result computation.
Burst analysis has two independent parts: deciding which adjacent photographs belong together, then ranking candidates within each group. RawCullCore implements these as deterministic engines. Optional deeper AI review is a subsequent stage.
Group boundaries
BurstGroupingEngine processes the supplied file order, compares each file with its predecessor, and starts a new group if any configured boundary condition fires. This is adjacent linkage: A may match B and B may match C even when A and C would differ. It is not all-pairs clustering.
Boundary evidence
Default rule
Visual distance
Split at distance >= 0.25
Missing visual distance
Always split
Capture time
Split when absolute gap > 2 seconds
Modification-date fallback
Use a 10-second maximum gap
Camera
Require the same normalized camera value
Focal length
Split when available focal lengths differ by > 3 mm
Shutter, aperture, ISO
Split when an individual change exceeds 0.5 EV
Exposure compensation
Split when change exceeds 0.34 EV
The defaults belong to grouping algorithm version 4. Camera and focal-length requirements are configurable. Lens changes are recorded in boundary evidence but do not independently split a group in this engine; they do affect metadata stability during ranking.
Exposure changes are compared individually, rather than canceled into a net exposure difference. Shutter and ISO deltas use abs(log2(new/old)); aperture uses 2 × abs(log2(new/old)); exposure compensation uses an absolute linear difference. If numeric conversion fails but both textual shutter, aperture, or ISO values exist and differ, an unquantified exposure change still creates a boundary.
The engine records the pair IDs, distance, absolute gap, fallback-time status, focal delta, maximum exposure adjustment, metadata-change flags, and boundary reasons. Missing focal data alone does not trigger the focal-length rule.
Candidate score
Let S = clamp(rawSharpness/catalogMaximum, 0, 1). Missing, non-finite, or invalidly normalized sharpness contributes zero. If at least two measured candidates have a normalized spread of at least 0.03, compute burst-relative sharpness R = (S−groupMinimum)/(groupMaximum−groupMinimum). The ranking sharpness component is then 0.65S + 0.35R; otherwise it is S.
The focus component is 0.70 with an AF coordinate and 0.45 without one. It measures availability of AF evidence, not AF sharpness. The saliency component is 0.45 without a subject label, 0.60 if no dominant label is available, 0.75 for the dominant group label, and 0.25 for another label.
Metadata starts at 0.70 when exposure, camera, and lens are stable, or 0.40 otherwise. Tight similarity adds 0.15; an aperture <= f/5.6 adds 0.05. ISO above 800 subtracts 0.05 per stop, capped at 0.15. Lower estimated motion risk adds 0.05; elevated risk subtracts 0.05 per stop, capped at 0.15. The final component is clamped to 0–1.
Motion risk uses shutter time multiplied by focal length when focal data exists: a ratio <= 0.5 is lower risk and > 1 is elevated risk. Without focal data, shutter times <= 1/500 second are lower risk and >= 1/60 second are elevated risk. These are metadata heuristics, not observed subject-motion estimates.
Candidates sort by descending overall score; ties retain input group order. The first and second become the recommendation and runner-up.
Confidence and review
Tight similarity means every internal boundary distance is below 0.22. Metadata stability excludes any internal exposure, camera, or lens change. Reliable capture time requires every file to avoid modification-date fallback.
High confidence requires at least three group members, a best-versus-second absolute overall gap >= 0.12, best normalized sharpness >= 0.65, stable metadata, tight similarity, and reliable capture times. A gap >= 0.05 with stable metadata gives medium confidence. Missing scores or other cases give low confidence.
The result’s isSafeForOneClickCulling flag is true only for high confidence. The engine returns scores, reasons, cautions, recommendation IDs, and review state; it does not itself mutate file ratings. Expression, moment, and framing are not directly measured by this ordinary ranking formula. Use subject evidence or Qwen Vision to understand the separate deeper-review stages.
RawCullCore/Sources/RawCullCore/BurstAnalysisModels.swift: defaults, version, and evidence types.
RawCullCore/Sources/RawCullCore/BurstRankingEngine.swift: ranking and confidence.
RawCull/RawCull/Intelligence/BurstAnalysis/: orchestration and cache compatibility.
7 - CLIP Model — Technical Detail
Technical documentation of RawCull analysis implementation and result computation.
CLIP supplies image and text representations for visual similarity and semantic search. RawCull’s Core AI provider runs separate image and text inference functions from a validated model bundle. It does not generate prose or measure optical focus.
Inference inputs
CoreAICLIPProvider reads runtime configuration that specifies function names, tensor input/output names, image preprocessing, and tokenizer behavior. RawCull includes model assets for OpenAI CLIP and DataComp CLIP; selected bundle identity and configuration determine which representation is used.
Image preprocessing resamples the source and prepares RGB values in channel-first order. Channels are converted from bytes to 0–1 floats, then normalized:
The implementation supports preprocessing paths selected by configuration, including Pillow-compatible bicubic resizing followed by integer center crop. When the resized excess is odd, the crop origin uses integer division rather than rounding a half-pixel offset. Crop and interpolation details can change embeddings, which is why preprocessing version participates in artifact compatibility. The tensor size comes from the loaded model configuration and descriptor; it should not be assumed universal across bundles.
Text preprocessing uses the configured CLIP tokenizer or Hugging Face tokenizer JSON. Tokens are padded to the model context length; truncation preserves an end token. Models with an attention-mask input receive that mask. Some converted function signatures also require dummy inputs for the unused modality, which the provider constructs to satisfy the exported model contract.
Outputs and calculations
The image function returns an embedding vector. Text inference validates a two-dimensional [batch, dimension] embedding output, supported float scalar type, and consistent element count. Model identity and backend accompany the representation.
CLIP’s learned encoders map image and text inputs into a shared feature space. RawCull computes similarity from the returned vectors rather than reconstructing the encoders’ internal layers. L2 normalization divides by vector magnitude, and image cosine distance is 1−cosineSimilarity, clamped to 0–2. Vision and CLIP indexes describes compatibility and storage.
Semantic search encodes a description and compares it with indexed image representations from the same model. Ranking indicates relative correspondence to the description. A similarity score is not a calibrated probability that a label is true, and it does not establish sharpness, eye focus, or aesthetic quality.
Use with subject review
CLIP supplies semantic evidence while SAM 3 supplies subject geometry. A semantic match and a mask can support the same workflow, but the numeric masked focus score is computed by RawCull’s image-processing scorer. It is not the CLIP embedding distance. The current Deep Review pipeline retains prompt verification and fallback evidence alongside that masked score.
Apple Vision feature prints provide another visual-similarity backend; they do not substitute for CLIP’s text encoder. Changing between OpenAI and DataComp bundles requires compatible indexing for the chosen model rather than combining their vectors.
Source map
PhotoAIKit/Sources/CoreAICLIPBackend/CoreAICLIPProvider.swift: model loading, tokenization, preprocessing, and tensor inference.
PhotoAIKit/Sources/PhotoAIContracts/ImageEmbedding.swift: normalization and image cosine distance.
RawCull/ModelAssets/Notices/CLIP-OpenAI/ and CLIP-DataComp/: bundle provenance.
8 - SAM 3 Model — Technical Detail
Technical documentation of RawCull analysis implementation and result computation.
SAM 3 supplies prompted subject masks and object instances. RawCull’s CoreAISAM3Provider adapts the Core AI segmentation runtime into PhotoAIKit contracts. The downstream sharpness calculation remains application-owned.
Segmentation input and output
The provider receives an image and a subject or object-concept prompt. The runtime predicts segments with masks, scores, and spatial information. The provider uses a mask threshold of 0.5 and converts runtime results into image masks and normalized geometry.
For the subject contract, compatible segments are combined into an exhaustive union mask: a pixel is included when any returned segment includes it. The adapter also contains probability-mask decoding and feathering around the threshold. Unioning multiple instances means a subject mask can include several animals or people; it should not be assumed to identify one individual.
The returned confidence is derived from runtime output, with decoding fallbacks where applicable. It represents segmentation evidence. It is separate from geometric mask quality, pixel detail, and recommendation confidence.
Object instances
The object contract retains individual masks instead of flattening them into a union. It validates mask dimensions and element counts, obtains a normalized box, and orders instances by descending score, then geometry, then original runtime order. Runtime masks use top-origin row-major coordinates; macOS box coordinates require vertical conversion.
In the Objects workflow, concepts come from manual queries or Qwen discovery. SAM 3 segments each concept. ObjectInstanceDeduplicator removes overlapping duplicate candidates before the application renders a review board with retained object IDs. Qwen then evaluates that board. Instance detection, deduplication, and language assessment are distinct stages, with separate timings and failure reporting.
From mask to result
PhotoAIKit measures mask coverage and bounding box and assigns geometric quality. A repository can reuse a cached mask for the same source and prompt; model and source compatibility determine whether evidence remains useful. Prompt fallback can provide a usable full-subject mask when a more specific head/face request is unavailable, and the review result records that fallback.
RawCull computes detail inside the chosen mask using broad robust-tail energy, best local-patch evidence, and micro-contrast. See Subject evidence for the exact 0.40 broad + 0.40 local + 0.20 fine formula and background penalty. SAM 3 does not return that sharpness score. It determines the pixels on which the application measures detail.
A geometrically plausible mask can still select the wrong subject. A union mask can also include a sharp secondary subject while the intended subject is soft. The stored prompt, geometry, AF membership, and local-detail evidence help explain the result.
Runtime boundary
The repository adapter exposes model loading, prompt submission, thresholding, decoding, and evidence contracts. The converted model’s learned segmentation internals execute inside Core AI. These docs describe the observable implementation rather than claiming an application-specific equation for the neural network’s confidence output.
Source map
PhotoAIKit/Sources/CoreAISAM3Backend/CoreAISAM3Provider.swift: subject union and object-instance adaptation.
PhotoAIKit/Sources/PhotoAIWorkflows/SubjectMaskSelection.swift and SubjectMaskQuality.swift: acquisition and validation.
RawCull/RawCull/Intelligence/ObjectAnalysis/RawCullObjectAnalysisFeature.swift and ObjectInstanceDeduplicator.swift: object workflow.
Technical documentation of RawCull analysis implementation and result computation.
Qwen Vision performs vision-language assessment of selected photographs and detected objects. It generates a response from an image attachment and an instruction. Its scores are model-generated judgments, followed by explicit application validation and weighting.
Loading and generation
CoreAIQwenProvider validates bundle metadata, a Qwen tokenizer identity, positive vocabulary and context lengths, and supported text or vision-language model kind. A vision bundle must contain vision configuration and the required embedding and vision assets. RawCull’s model provenance identifies a Qwen3-VL-2B asset pack; the provider reads configuration from the actual selected bundle.
QwenInferenceRuntime lazily creates and reuses a CoreAIVisionLanguageModel. Each request creates a LanguageModelSession, attaches the image, supplies the instruction, and passes a maximum response-token budget through GenerationOptions. A generation gate serializes shared requests. Cancellation and model-generation checks prevent obsolete work from being accepted after runtime changes.
The ordinary photo request uses a 512-token response budget. This limits generated output length, not the image resolution or the entire model context. The call sets the token budget explicitly; these docs do not assume an application-fixed temperature or sampling configuration absent from that call.
Photo assessment and numeric score
The default review criteria cover composition, exposure, subject visibility, expression, and obstructions. The structured assessment contains subject text, composition score, exposure score, subject-visibility score, optional eyes-open state, problems, strengths, and confidence.
The decoder extracts the first opening brace through the last closing brace and attempts JSON decoding. Validation requires each numeric assessment score to be in 1–5 and confidence in 0–1. RawCull computes the overall score from valid fields:
Thus the validated weighted score ranges from 0.2 to 1.0. Expression and eyes-open information can appear in the assessment but have no separate term in this formula. Generated confidence also does not multiply the overall score.
Nonempty responses that cannot be decoded as a valid structured assessment are retained as freeform text. They remain useful review output, but do not acquire an invented numeric score. Empty output fails. Per-file results keep structured assessment, freeform output, or failure information.
Objects workflow
Automatic object discovery first asks Qwen for concepts with a 384-token budget; manual concept mode bypasses that request. SAM 3 segments each concept and the application deduplicates instances. It renders a review board with object identifiers, then sends that image and object-specific criteria to Qwen with a 1024-token budget.
ObjectAnalysisResponseDecoder checks the response against the board’s allowed IDs. If structured decoding fails, the application retains the generated response as freeform output. If no instances survive segmentation, the workflow returns no object assessment rather than asking Qwen to assess an empty board.
This use of explicit instance IDs makes a generated observation traceable to a retained mask. It does not make the language model’s judgment a physical focus measurement. Object confidence, segmentation confidence, and the photo weighted score remain separate outputs.
What computes the result
The vision-language runtime encodes the attached image and generates response tokens conditioned on the instruction and image representation. RawCull delegates that learned inference to Core AI, then parses and validates output and applies the documented weighting formula. It does not compute composition or exposure ratings using a deterministic pixel formula.
Prompt wording, input image, model bundle, and generation behavior can influence assessments. Use Qwen explanations alongside the deterministic sharpness measurement and subject evidence when comparing finalists.
Source map
PhotoAIKit/Sources/CoreAIQwenBackend/CoreAIQwenProvider.swift: bundle validation and runtime construction.
RawCull/RawCull/Intelligence/Qwen/QwenInferenceRuntime.swift and QwenGenerationGate.swift: request execution and token limits.
RawCull/RawCull/Intelligence/Qwen/QwenPhotoAssessment.swift: schema, validation, freeform fallback, and score formula.
RawCull/RawCull/Intelligence/ObjectAnalysis/: discovery, review-board rendering, and response decoding.
RawCull/ModelAssets/Notices/Qwen/PROVENANCE.json: model asset provenance.